Index Analysis for 19/02/2015
Dear Traders,
Here's the Index Analysis for 19/02/2015 : 05:58...


So on the daily chart we can see a clear uptrend since the SNB intervention.

Here's the Index Analysis for 19/02/2015 : 05:58...
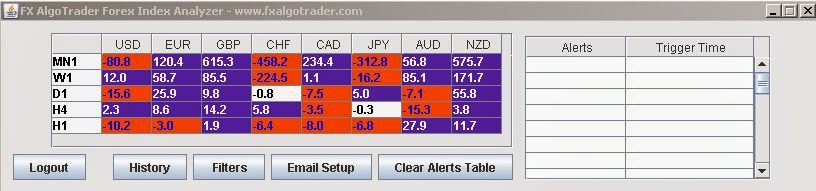
So we can see GBP is the strongest currency for Feb and CHF is the weakest..
On the shorter timeframes we're seeing GBP strength on a 4 hour basis and NZD weakness...
And on the hourly charts we're seeing EUR strength and NZD weakness...
So a slightly mixed picture.
What we'd ideally like to see is a situation where we have clear strength and weakness across all the timeframes.. or at least most of them. From the data here a long GBPCHF trade is probably the most appealing as it's in line with the longer term index data.
So let's examine the GBPCHF chart...
On the H1 chart we can see a clear pivot confluence at the Weekly R1, the Quarterly S3 and the central pivot for the day PP I generated these pivots using the Quarterly rolling pivots tool and the V3 Pivots tools (for daily/weekly and monthly)...
This confluence level would be an ideal entry point to go long GBPCHF.... so long around 1.4475-1.4485 with an upside target of 1.459.
Comments
Post a Comment